


If you manage people, absenteeism rates by industry give you a fair yardstick. They tell you whether your absence problem is normal or a warning sign. I am Sadia, and I spend my days helping HR teams read numbers like these. This guide shows what a healthy rate looks like across sectors. It also covers how Bangladesh compares, and what I do next.
What an absenteeism rate actually means
An absenteeism rate is the share of scheduled work time that staff miss. It counts unplanned absence, not approved holidays. The formula is simple and worth memorising.
Absenteeism rate = (absent days divided by available work days) times 100.
Say one worker misses 4 of 20 shifts in a month. That is a 20% personal rate. For a whole team, you add every absent day and divide by every scheduled day. I track this monthly, since one bad week can hide inside an annual average.
| Term | What it means |
|---|---|
| Absence rate | Percent of scheduled hours lost to unplanned absence. |
| Lost time rate | Total absent hours as a share of total available hours. |
| Planned absence | Approved leave, such as annual or maternity leave. |
| Unplanned absence | Sick days and no-shows you did not schedule. |
| Bradford Factor | A score that weights frequent short absences more heavily. |
Absence sits among the core numbers I watch. It belongs beside the other KPIs and metrics every HR manager should track.
Absenteeism rates by industry: the benchmarks
Absence is not spread evenly. Some sectors lose far more time than others. The chart below shows the pattern across US industries, where the data is most complete.
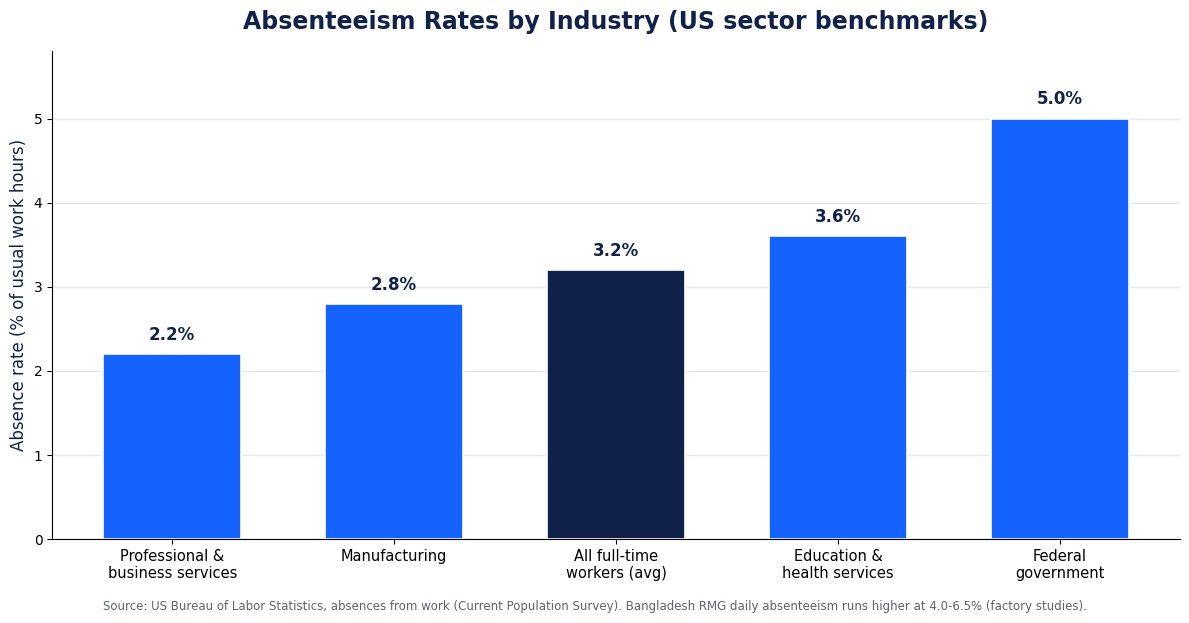
The table gives a wider view, including Bangladesh. Treat these as reference points, not hard targets. Your own baseline matters more than any national figure.
| Industry or sector | Typical absence rate | Notes |
|---|---|---|
| Professional and business services | ~2.2% | Among the lowest; more remote and flexible roles. |
| Manufacturing | 2.8% | Injury and illness drive most lost time. |
| All full-time workers (average) | 3.2% | 2.2% illness or injury, 1.0% other reasons. |
| Education and health services | 3.6% | High in hospitals and social care. |
| Public sector (federal) | 5.0% | Highest band in the US data. |
| Bangladesh garment (RMG) | 4.0 to 6.5% daily | Factory studies; heat and turnover push it up. |
Sectors that lose the most days
Healthcare, social care and public administration sit at the top. Shift work, physical strain and exposure to illness all add up. Nursing and homecare roles report some of the highest rates of all.
Sectors that lose the fewest days
Professional, technical and business services sit at the bottom. Desk roles allow remote work on a rough day. That single option keeps many mild-illness absences off the books.
What counts as a normal absenteeism rate
Most HR teams treat 1.5% to 4% as a healthy band. Below that, check that people feel safe taking real sick days. Above 4%, I start asking why.
Here is my honest take. A rate that looks perfect can hide a problem. When staff drag themselves in while ill, output drops and bugs creep in. That hidden loss rarely shows in your absence report.
Absenteeism, presenteeism and turnover: know the difference
These three numbers get mixed up often. Absenteeism is unplanned time away from work. Presenteeism is showing up while unwell and working at half pace.
Turnover is staff leaving for good. High absence often comes before high turnover. I read them together, since one warns me about the next.
How absenteeism in Bangladesh compares
Local data is thinner, but the garment sector is well studied. Menzel and Woodruff recorded daily absence near 4% across 60 factories. Macchiavello and colleagues found 6.5% in a smaller sample.
Annual turnover above 30% sits alongside those numbers. Heat stress makes it worse during summer peaks. One recent study linked rising temperatures to higher absence and a drop in output.
For factory and field teams, accurate records are the first fix. A reliable biometric attendance system removes guesswork from the daily count. You cannot manage a number you cannot trust.
Culture and record-keeping both matter here. Many small firms still track attendance on paper. That gap hides the true rate until payroll day.
What absenteeism really costs your business
The bill is larger than the missed wages. Cover, overtime and lost output all stack on top. US employers lose about $225.8 billion a year to worker illness and injury.
| Cost measure | Figure |
|---|---|
| Total US cost of worker illness and injury | $225.8 billion a year |
| Cost per employee | About $1,685 a year |
| Full-time hourly worker | Around $3,600 a year |
| Salaried worker | Around $2,660 a year |
| Replacement worker output | Roughly 30% less productive |
Absence also delays payroll and muddles overtime. Clean attendance data feeds a tidy payroll management system. That link alone saves my team hours each month.
In Bangladesh terms, the logic still holds. A missed shift on a production line can stall the whole line. The cost spreads far past one absent wage.
Why employees actually miss work
Minor illness still leads the list. Colds, flu and stomach bugs cause most short absences. Yet mental health has climbed fast and now ranks second for short-term absence.
For long absences, mental ill health is the top cause. Stress feeds both short and long spells. Research on common mental disorders confirms how strongly they shape sickness absence and return to work.
Personal and family duties also play a part. Childcare, elder care and travel all pull people away. Flexible scheduling can absorb some of these without lost output.
How I bring absenteeism down
I start with data, not blame. A clear baseline shows whether a spike is one team or the whole floor. Guesswork here wastes goodwill and time.
Then I fix causes, not symptoms. If night-shift absence is high, I look at rest, travel and safety first. Small changes to scheduling often beat any warning letter.
My contrarian point is this. Chasing a zero absence target usually backfires. It pushes sick people to show up, spread illness and work at half speed. I would rather see a steady 3% than a fake 0%. For the day-to-day playbook, I lean on this guide to crushing absenteeism and building accountability.
Five steps I use to reduce absenteeism
No single trick fixes absence. I work through the same short list every time.
- Set a clear baseline. Pull three months of clean attendance data first.
- Spot the pattern. Check which team, shift or season drives the spike.
- Talk early. A quick return-to-work chat beats a formal warning.
- Fix the cause. Adjust rest, travel, safety or workload where you can.
- Review monthly. Compare the new rate against your baseline, not a rumour.
This loop keeps absence honest without scaring staff into silence. It also gives me proof when I ask for budget. Numbers move managers faster than opinions do.
Key takeaways
- The average absence rate across US industries is about 3.2%.
- Healthcare and public sector roles lose the most days; professional services lose the least.
- A 1.5% to 4% rate is normal; above 4% deserves a closer look.
- Bangladesh garment factories report 4.0 to 6.5% daily absence.
- Absence costs around $1,685 per employee each year.
- Measure first with trusted attendance data, then fix root causes.
Frequently asked questions
What is a good absenteeism rate?
Most HR teams aim for 1.5% to 4%. A figure inside that band is usually healthy. Below it, make sure people feel safe taking genuine sick leave.
Which industry has the highest absenteeism?
Healthcare, social care and public administration lead. Shift work and illness exposure drive their higher rates. Nursing and homecare roles rank near the top.
How do I calculate an absenteeism rate?
Divide absent days by available work days, then multiply by 100. Do it for one person or a whole team. Track it monthly so short spikes stay visible.
What is the average absenteeism rate in Bangladesh?
Sector data is limited, but garment studies help. Daily absence runs from about 4.0% to 6.5% in factories. Heat and high turnover push those numbers up.
References
- U.S. Bureau of Labor Statistics. Absences from work of employed full-time wage and salary workers (Current Population Survey). bls.gov/cps
- CIPD (2025). Health and Wellbeing at Work: workplace absence. cipd.org
- CDC Foundation (2015). Worker Illness and Injury Costs U.S. Employers $225.8 Billion Annually. cdcfoundation.org
- Tarro L, Llaurado E, Ulldemolins G, et al. (2020). Effectiveness of Workplace Interventions for Improving Absenteeism, Productivity, and Work Ability of Employees. IJERPH. doi.org/10.3390/ijerph17061901
- Macchiavello R, Menzel A, Rabbani A, Woodruff C (2020). Challenges of Change: Promoting Women to Managerial Roles in the Bangladeshi Garment Sector. NBER Working Paper 27606. doi.org/10.3386/w27606
- Yuan D, Gazi MAI, Rahman MA, et al. (2022). Occupational stress and health risk of employees in the garments sector of Bangladesh. Frontiers in Public Health. doi.org/10.3389/fpubh.2022.938248
- de Vries H, Fishta A, Weikert B, et al. (2017). Determinants of Sickness Absence and Return to Work Among Employees with Common Mental Disorders. J Occup Rehabil. doi.org/10.1007/s10926-017-9730-1